Guides · 5 min read
Time on page and bounce rate: what they really tell you
A clear guide to engagement metrics in privacy-first analytics: visit duration, time on page, bounce rate and views per visit.
By the StaTrak team ·
Visitor counts tell you how many people arrived. Engagement metrics tell you whether the visit was worth it. They are also among the most misread numbers in analytics.
Visit duration
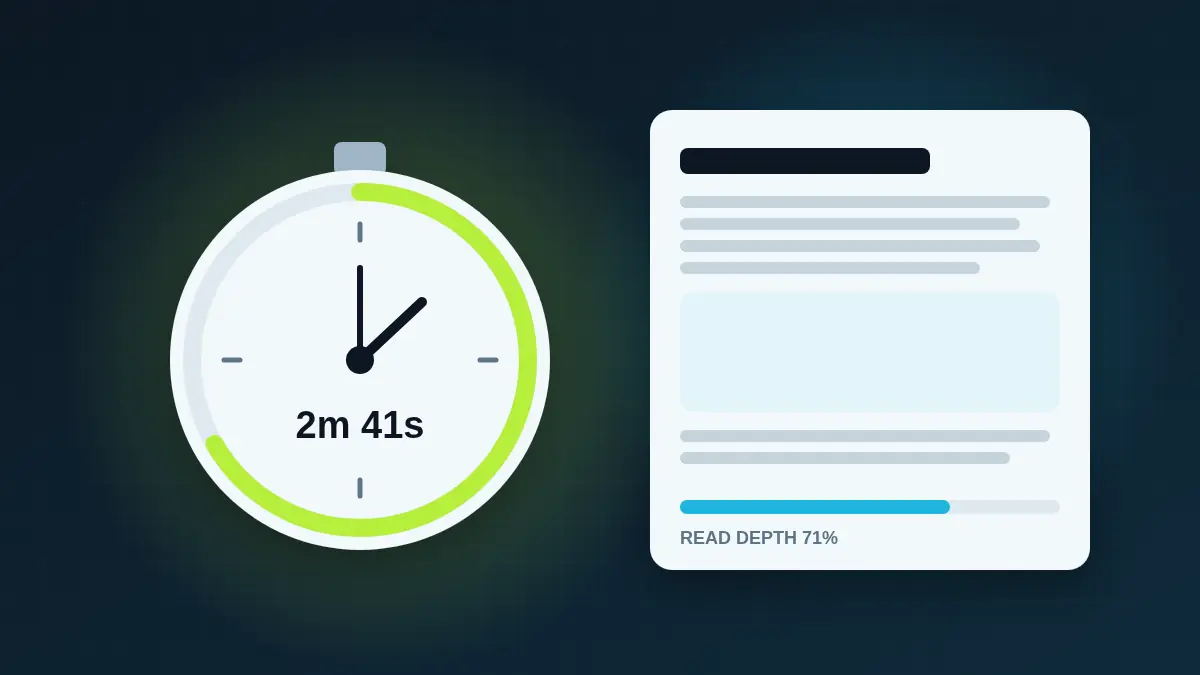
Visit duration is the time between the first and last activity in a visit. StaTrak measures it with a lightweight engagement ping while the tab is visible, so a page left open in a background tab doesn't inflate the number.
Time on page
Time on page is the average time visitors spent with a page in the foreground. Compare it with the length of the content: a 2,000-word guide with a 40-second average probably isn't answering the question its title promises.
Bounce rate
A bounce is a visit with a single pageview and no further interaction. A high bounce rate isn't always bad: a visitor who found your opening hours on the homepage and left got what they needed. Judge bounce rate against the page's job.
- Landing pages and product pages: lower is better, because the goal is a next step.
- Blog posts and documentation: high bounce with long time on page is often fine.
- Contact and location pages: high bounce is expected.
Views per visit
Views per visit shows how far people explore. Clear internal links, related-article sections and helpful navigation raise it. A sudden drop often points to a broken menu or link.