
How it works
Useful analytics in two minutes, without cookies
Here's everything StaTrak does, from the moment you sign up to the moment a visitor's pageview appears on your dashboard.
Getting started
Four steps, no configuration
- 1
Create your free account
Sign up with your email. Every feature is included, with unlimited websites and no credit card.
- 2
Add your websites
Type a domain, or paste a list of hundreds to add them all at once. Each one gets its own dashboard.
- 3
Paste one line of code
Put the snippet in your site's <head>. It loads in the background and never slows your page down.
- 4
Watch the numbers arrive
Your report goes live with the next visit: visitors, pages, sources, locations and more.
<script defer data-domain="yourwebsite.com" src="https://statrak.com/js/script.js"></script>Your free account
Everything included. Free.
No trials, no tiers and no credit card. Add as many websites as you run and use every feature from day one.
- Unlimited websites
- Every report and metric
- Bulk import and portfolio view
- Search Console keywords
- Live visitors
- Shared links and CSV export
How we keep it free
The script adds a small “Analytics by StaTrak” link to your site's footer, so other site owners can find us. It matches your footer's colours, sets no cookies and collects nothing. You choose where it appears.
Light footer · © Your Website
Analytics by StaTrak
Dark footer · © Your Website
Analytics by StaTrak
Under the hood
What happens when someone visits your site
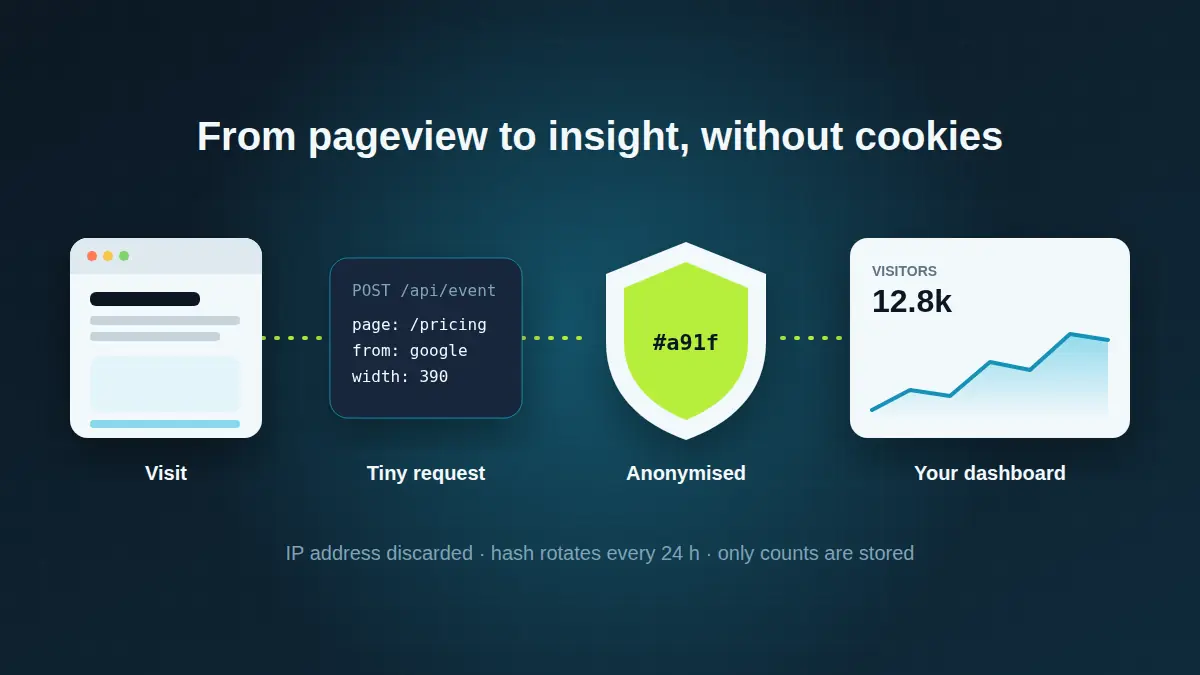
Five steps turn a pageview into an anonymous count. None of them needs a cookie.
- 1
A visitor opens your page
The script loads after your content, so it never blocks rendering. It doesn't read or write cookies, and doesn't store anything on the visitor's device.
- 2
The script sends one small request
It sends only the page address, the referring page, the screen width and any UTM campaign tags. When the visitor leaves, a second request records how long the page was in view.
- 3
The server looks up the location, then forgets the IP
The IP address is used to find the country and city, then discarded. It's never written to disk.
- 4
A daily hash counts unique visitors
The IP and browser are combined with your domain and a random salt that is deleted every 24 hours, then hashed. That's enough to count unique visitors today, but it can't identify anyone or follow them across sites or days.
- 5
Only aggregated counts are kept
Pageviews become counts per page, source, country and device. Your dashboard reads those counts. No individual visitor records exist to leak or sell.
Want the details? Read exactly what we collect and what we never collect.
Features
Every metric, and how it's measured
Each number on your dashboard comes from the same small request, measured the same privacy-safe way.
- Unique visitors
- Distinct daily visitor hashes in the period. Shows your reach.
- Pageviews
- Every page load and single-page-app route change.
- Views per visit
- Pageviews divided by visits. Shows how far people explore.
- Bounce rate
- Share of visits with a single pageview and no further interaction.
- Visit duration and time on page
- How long visits last and how long each page is read, counted only while the tab is visible.
- Sources
- Search, social, referral, email, AI assistants and direct, from the referrer and UTM tags.
- Countries and cities
- Looked up from the IP address at the moment of the visit. The IP is then discarded.
- Search keywords
- Aggregated queries, clicks, impressions and positions from your connected Google Search Console.
- Devices
- Browser, operating system and screen size category, read from the browser's own headers.
- Live visitors
- People active on the site in the last few minutes.
- Site health
- A check of your homepage every 5 minutes, plus SSL and domain expiry and whether pageviews are still arriving.
- Custom events
- Sign-ups, downloads or purchases you send with one line of JavaScript.
One account for hundreds of websites
Every site you add appears on one overview with its visitors, trend and live count. Search, sort by growth or decline, group sites and star the ones you check daily. Jump to any site's full report with ⌘K.
Try the 1,240-site demonorthlabs.io
6148.1k
visitors · 30d
cedarjournal.com
1412.4k
visitors · 30d
tidalsupply.shop
99,312
visitors · 30d
koibakery.com
33,870
visitors · 30d
quartzdocs.dev
2821.9k
visitors · 30d
amberstudio.co
11,204
visitors · 30d
FAQ
Good questions
Know your visitors. Keep their privacy.
Free for every website you run. Start with one, or bring your whole portfolio.